 Wyckoff IQ
Everything you need to read accumulation and distribution ranges the way Wyckoff traders do, no jargon left unexplained, one page, start to finish.
Richard Wyckoff was a stock market operator in the early 1900s who noticed that before big price moves, large operators, the Composite Man, build or unload their position gradually inside a defined trading range, while retail traders see only sideways noise.
The Wyckoff Method is a framework for reading that range: working out which side is in control, and spotting the price-and-volume events that signal which way it's about to resolve. The two schematics that matter most are Accumulation (resolves upward) and Distribution (resolves downward), mirror images of each other unfolding in the same five phases, A through E, described below.
Reading all of this by eye in real time is the hard part, which is what Wyckoff IQ automates: it labels each climax, test, and retest the moment it happens, using the same Tap 1 → 2 → 3 sequence mapped to the classic terms further down this page.
Both schematics unfold in the same five phases (A through E); only the direction of the eventual breakout differs.
A sharp, high-volume climax marks exhaustion of the prior trend, followed by a rally (or reaction) that sets the far side of the range.
Price ranges sideways while the Composite Man builds or unwinds a position. Often the longest phase, with multiple tests of both boundaries.
A decisive test of the range, a Spring or Upthrust, pierces one side to trap the wrong crowd before reversing sharply back inside.
Price moves through the range with a clear bias, followed by one final, lower-volume retest of the breakout area.
Price departs the range decisively, the markup or markdown the entire range was quietly preparing.
Accumulation and Distribution each have two recognized variants, Model 1 (the standard schematic, with a Spring/Upthrust test in Phase C) and Model 2 (where the test happens earlier, without a Phase C Spring/Upthrust). Every label below maps directly to the phases and glossary on this page.
The Tap 1 → 2 → 3 sequence Wyckoff IQ labels automatically maps to the same classic events for Tap 1 and Tap 2 in both models; only Tap 3 and Tap 3 Ext differ.
The questions traders ask most before putting the Wyckoff method to work.
Instead of manually tracking Phase A through E on every chart, Wyckoff IQ detects the range, marks Tap 1, 2, and 3, and draws the Range POI / Range Extreme POI zones where the schematic is statistically most likely to resolve, across 1,000 coins, on every timeframe.
When a new tap forms, an alert lands in Discord immediately, so you're reading the schematic, not hunting for it.
Get Access Now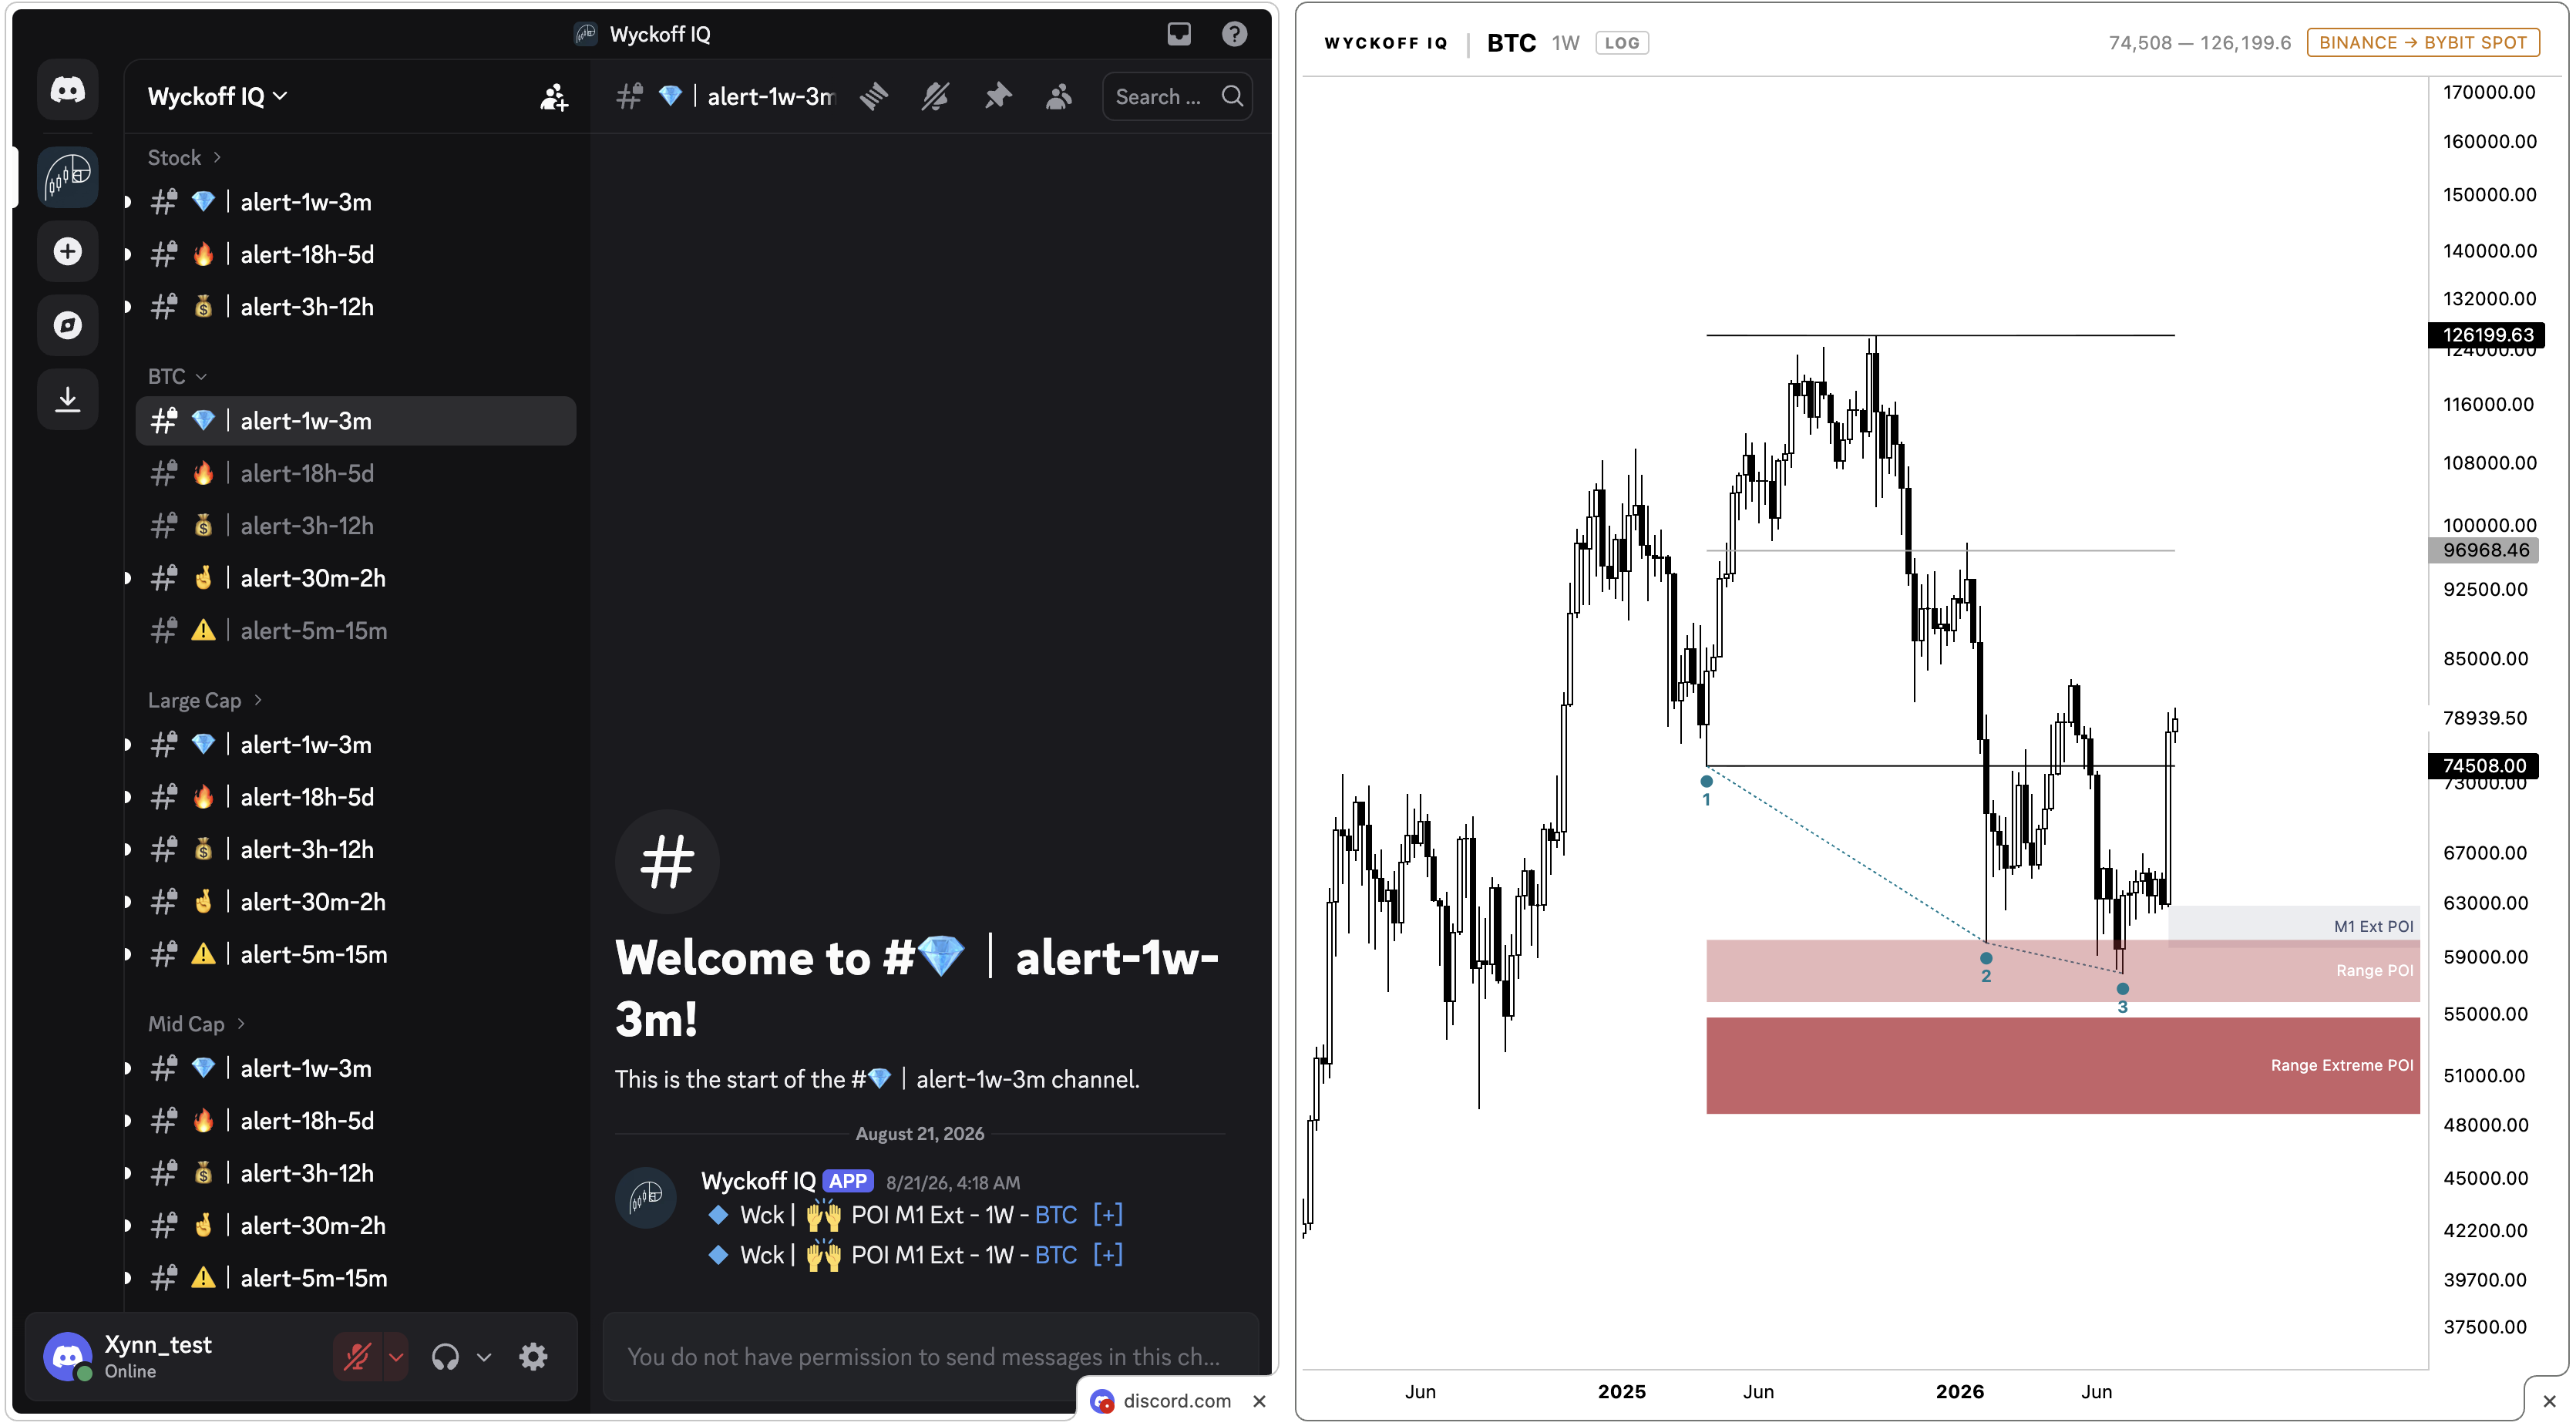
Wyckoff IQ detects these schematics automatically, in real time, and sends you the alert the moment a tap confirms.
This page is educational only and describes a general market-reading framework; it is not financial advice, and no schematic guarantees a specific outcome. Wyckoff IQ labels potential setups; all trading decisions remain your own.